Using Dashboard to compare measurements of a Node-S that is collocated with a Reference Monitor
How to use the Analytics / Collocations page on Dashboard to view comparison charts and accuracy metrics such as R2 and RMSE.
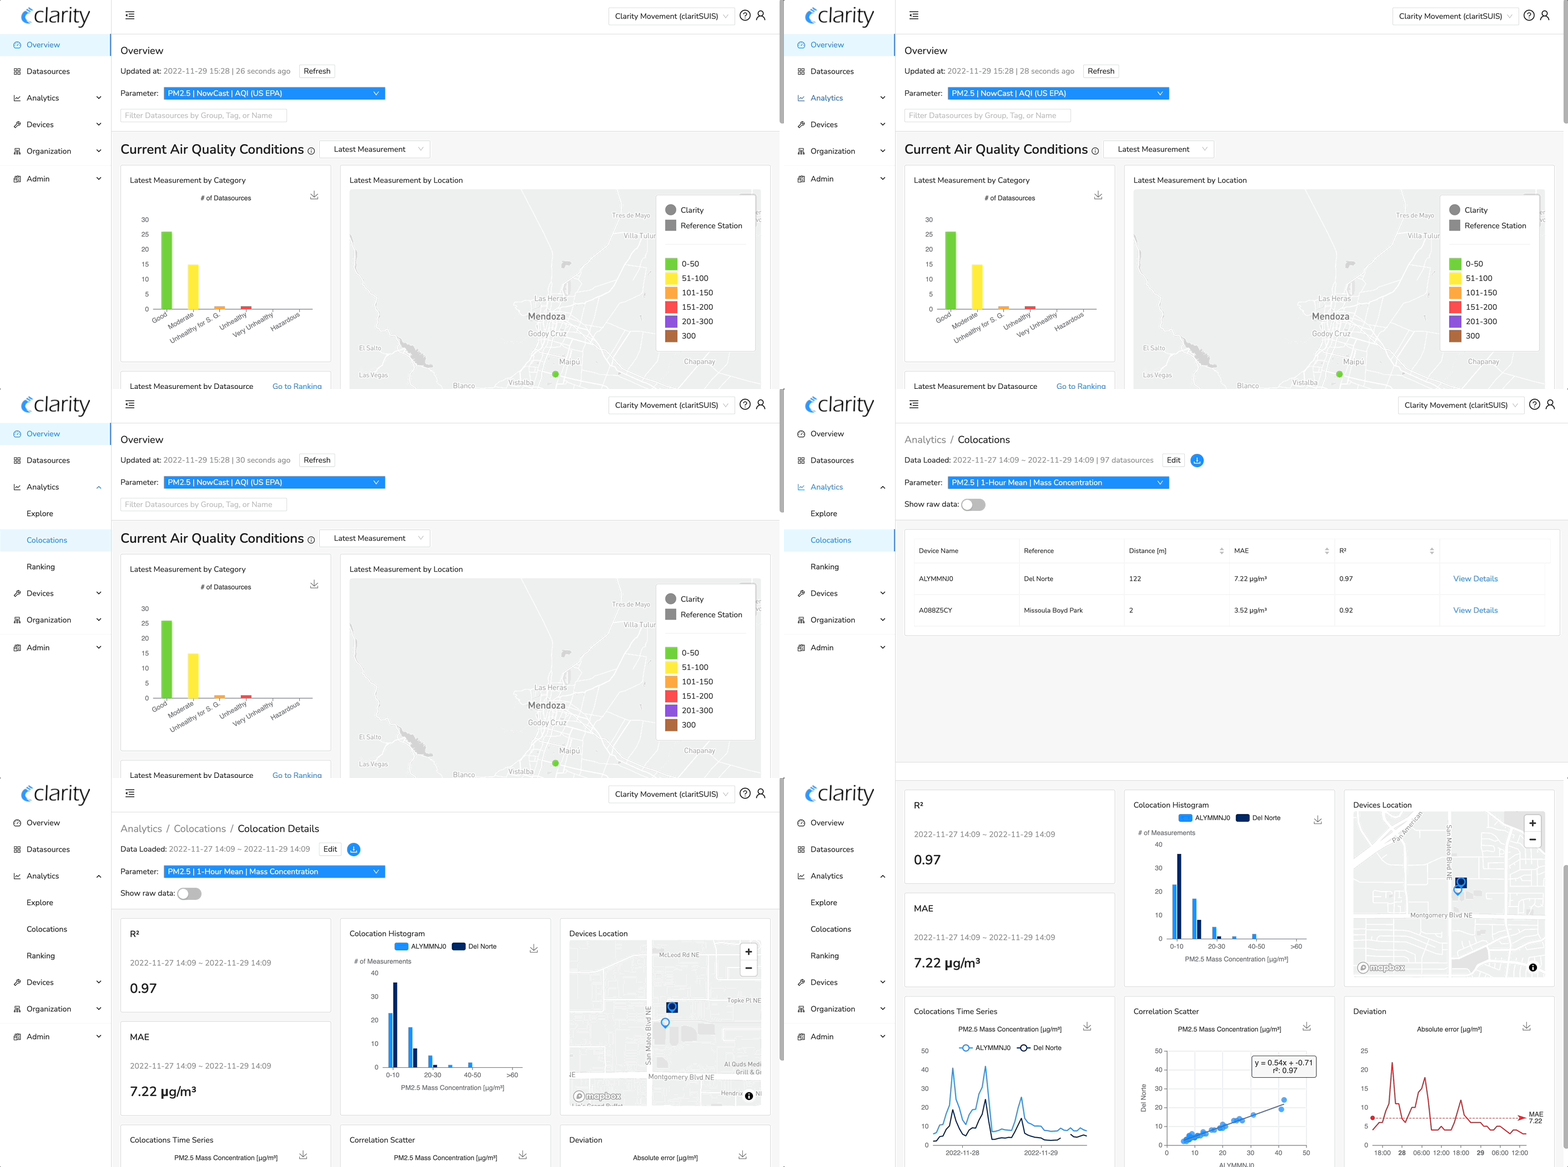
- Easily see correlation coefficients (R²), mean absolute error (MAE), and plots comparing your collocated Clarity device with a reference monitor.
- Nearby reference monitor data that are publicly available are added automatically to your account once Clarity devices are active.
- To learn more about R2 and MAE, read our blog series on "How to Assess Sensor Accuracy":
Note: Only hourly or daily averaged data can be compared in the Collocation page.
1. Go to Clarity Dashboard.
2. Once logged in, select the Analytics dropdown and then Colocations.
3. Then you can view your list of Clarity devices that are collocated with a reference monitor, as well as the distance between the Clarity device and reference monitor, MAE, and R².
4. Select View Details to compare this data in more detail.

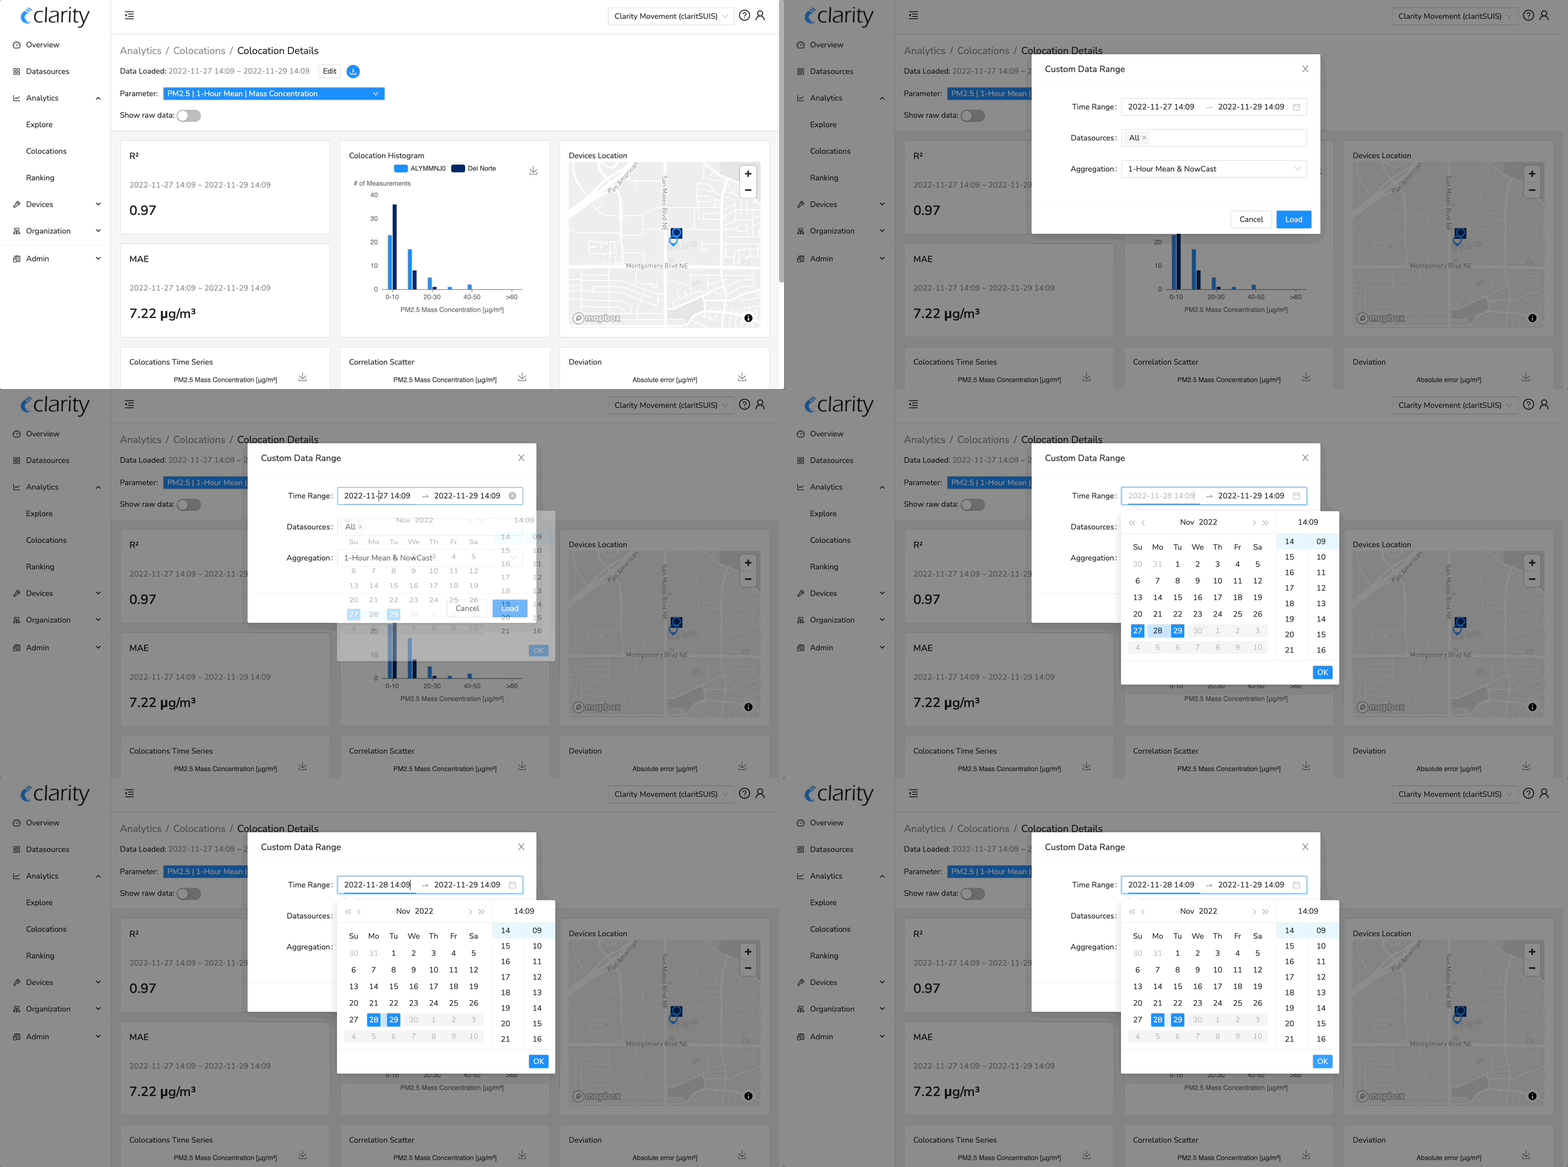
5. You can also change the time period, resolution of the data, and the desired datasources by clicking on the Edit button at the top of the Colocations page.
6. To change the parameter, click on the Parameters dropdown. Select "OK" to load in the page.

