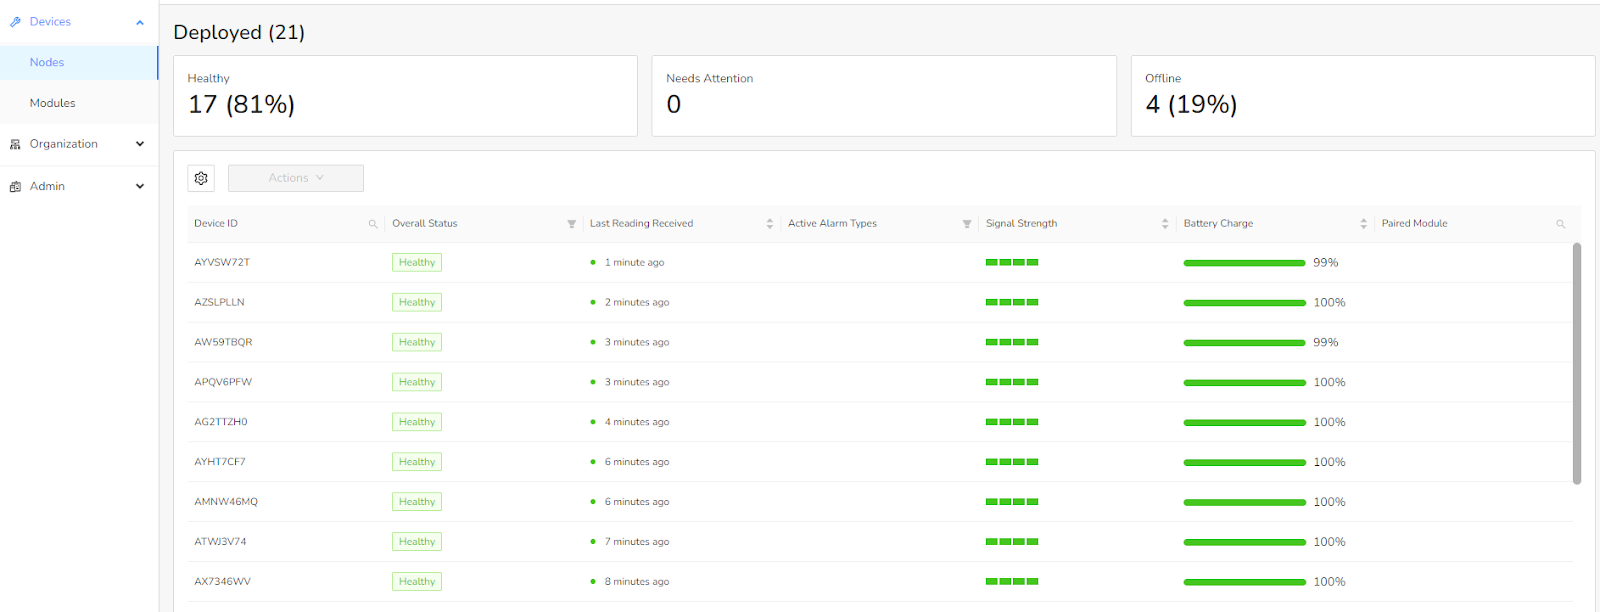
Navigating to the Device Status Details page
To navigate to this page, you can select a device of interest from the Device > Nodes table which displays the list of managed devices.
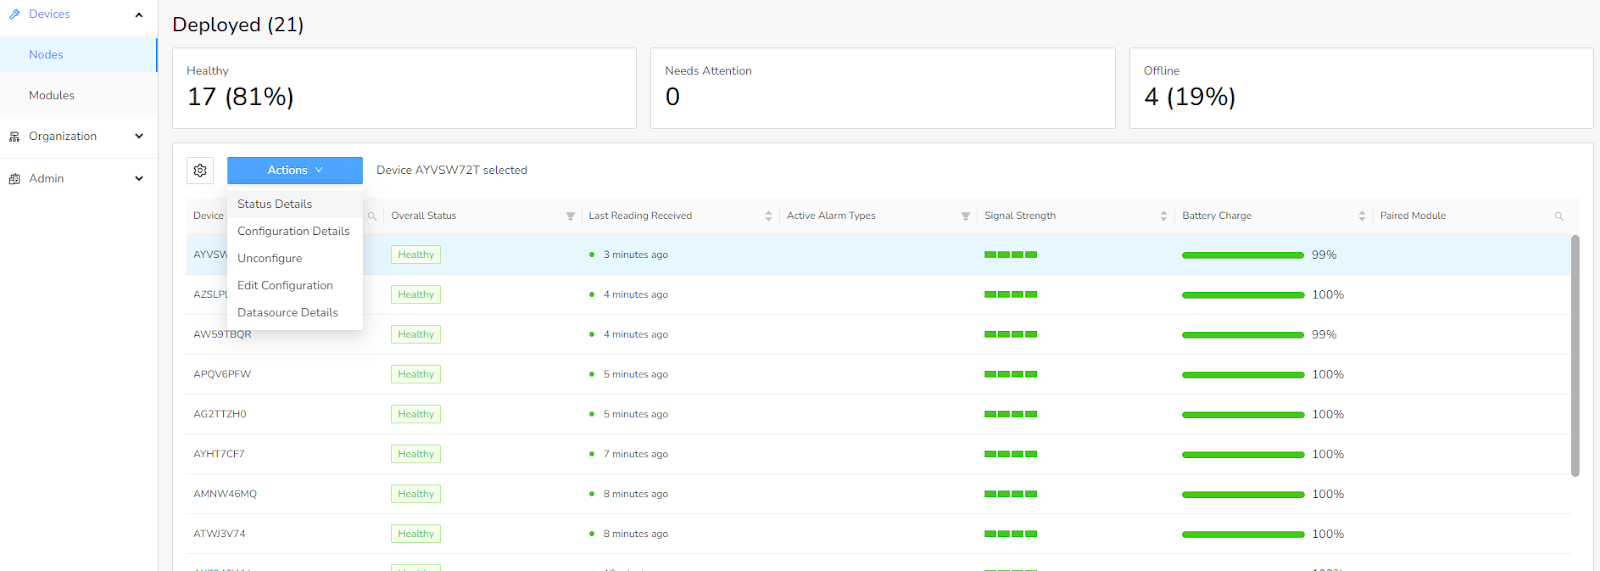
After selecting a Device, the blue Actions dropdown will be enabled. Select Device Details from the dropdown and you be will be navigated to the Device Status Details page.
Overall Device Status
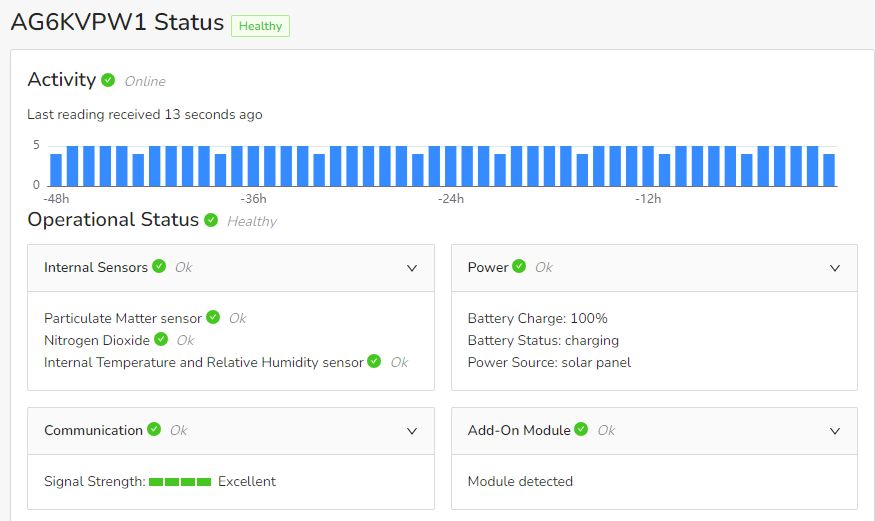
At the top of the page, the Device Status section describes what is going on with the device operationally. Before reviewing this place, please remember to manually click “Refresh” at the top of the page to get the status based on the latest readings.
This provides a summary of the current device status which will be one of the following:
- Healthy: Device is working well
- Needs Attention: Device has active alarms
- Offline: Device has not been reporting
If any of the sub-systems under Operational Status has any active alarms, the overall status of the device will display Needs attention. If the device has a Late Reading, the overall status of the device will display Offline.
Activity
The Activity section lets you know if Clarity Cloud is receiving readings from the device, by displaying one of the following:
- Online: Device had uploaded a reading at the expected time
- Offline: Device has not been uploading a reading at the expected time
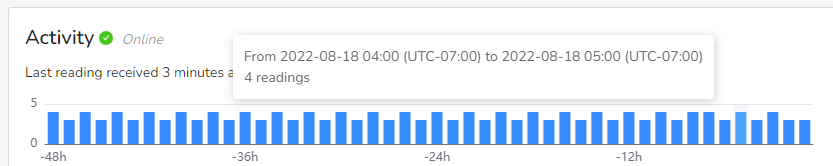
It will also display when the last reading was received. The time-series bar chart shows the count of hourly data points in the last 48 hours. You can hover over each bar to view the timestamp hour in local time and number of readings received in that hour.
Operational Status
The Operational Status section contains detailed information about the specific status of the four sub-systems that comprise the Node:
- Internal sensors
- Communication: if the device is reliably connected to the cellular network (if device is cellular)
- Power: if the Device’s ability to harvest and store power (if battery powered).
- Add-on Modules: If an add-on module is sensed by the Clarity Node-S
If any of the sub-systems under Operational Status has any active alarms, the Operational status of the device will display Needs attention.
The status for each sub-system will display one of the following:
Ok: Operating normally
Alarms: One of more active alarms
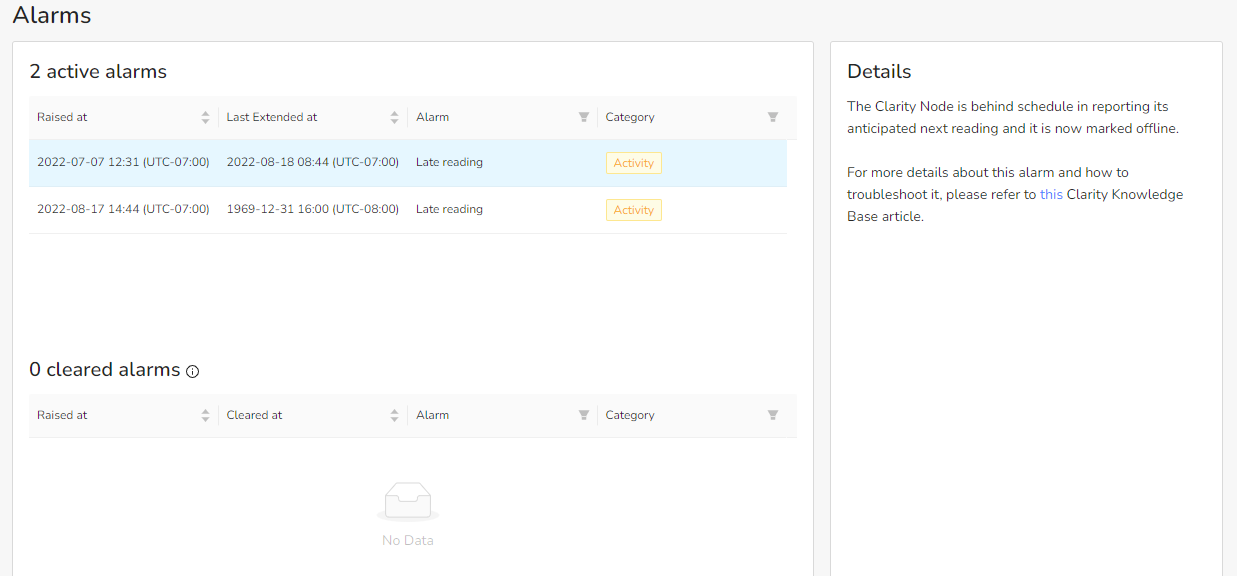
Alarms
Alarms are based on criteria applied to a period of readings from the device. For example, if at least 25% of the raw PM2.5 mass concentration values exceed 3,000 µg/m³ in the last 3-hour period, an alarm will be activated. This alarm is re-evaluated periodically will be extended if the underlying cause of the alarm persists. Once analysis of telemetry over time shows that the problem has subsided, the alarm is cleared.
Below the Overall Device Status section, the Alarms section displays details for each alarm. The alarms will be grouped accordingly:
- Active: these alarms are still present based on the definition of that alarm
- Cleared: Alarms automatically clear when the problem is no longer occurring
Each alarm will be timestamped with Details displaying on the right panel. More information on each alarm and how to troubleshoot will also be provided. To dig into the possible alarms, please head to the Device Alarms Glossary for Clarity Device Status.