How to view and interpret air quality exceedances shown on Dashboard and Email Digest.
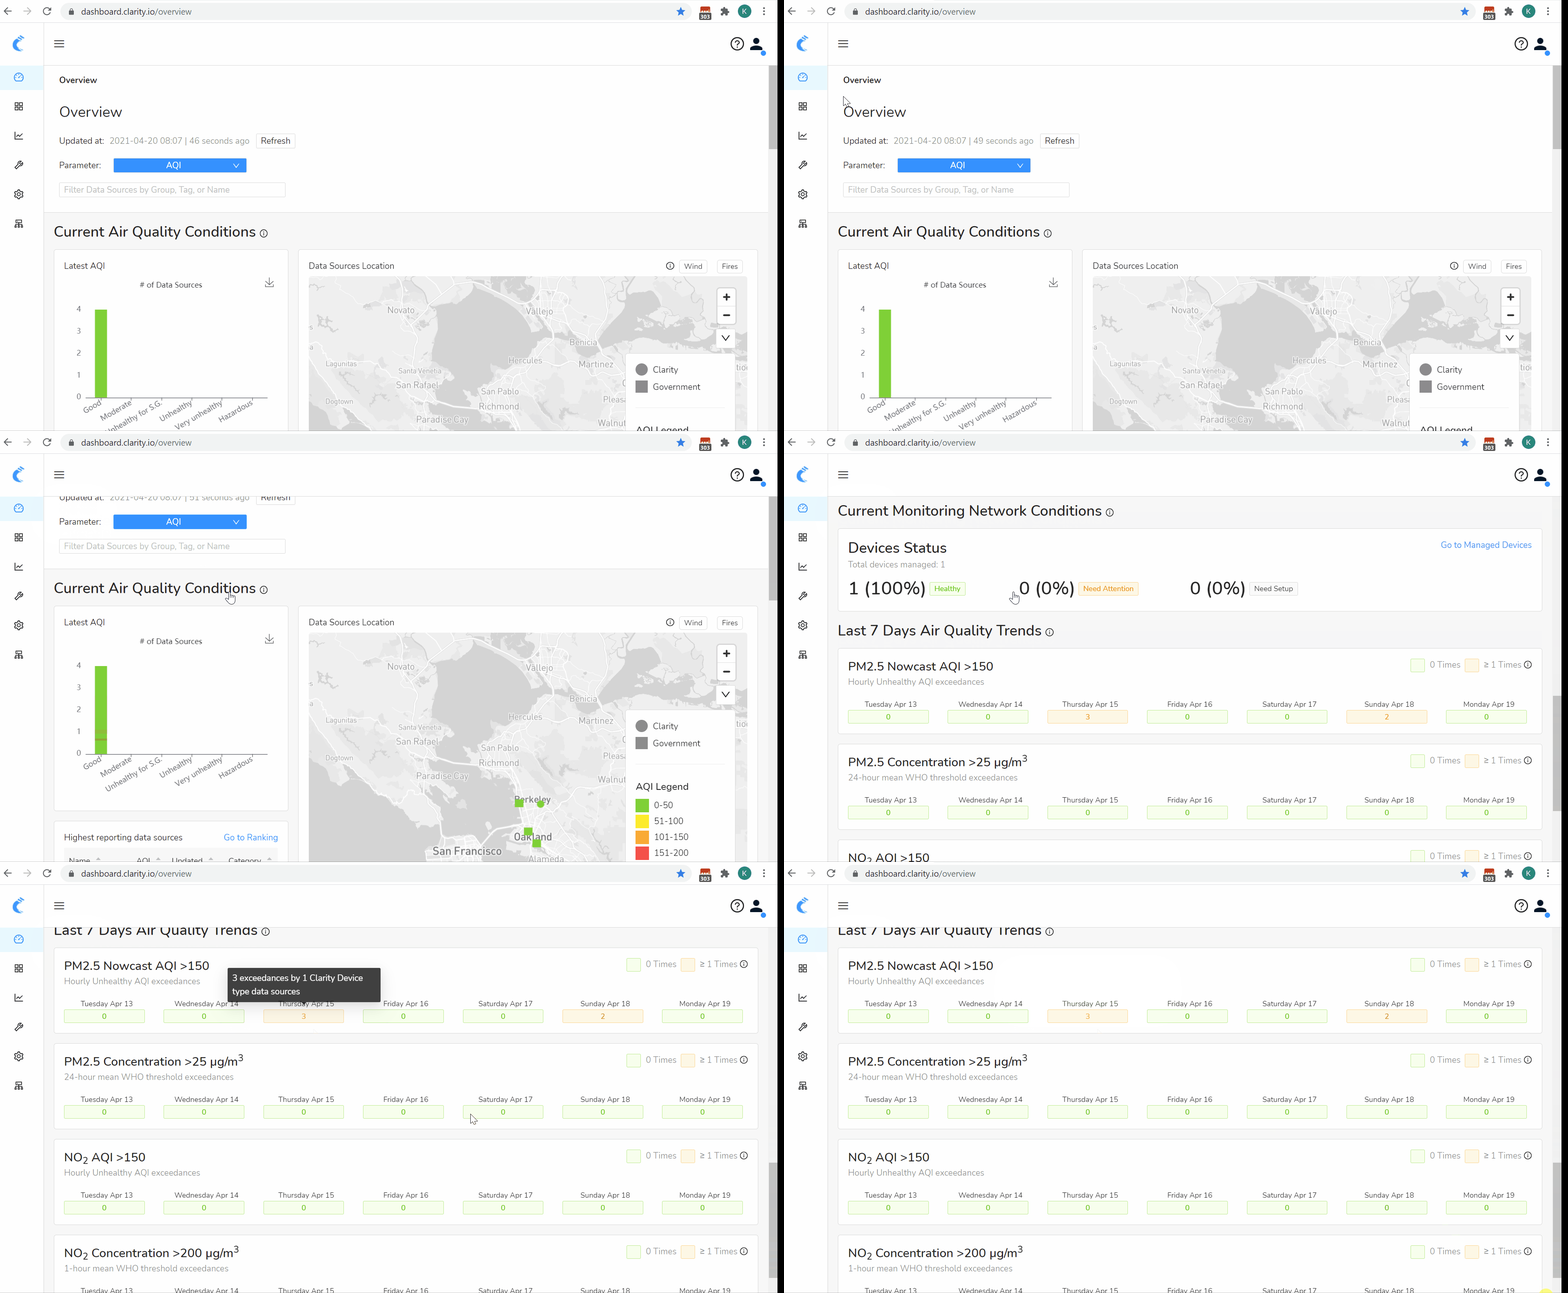
You can now see at a glance whether the Clarity data sources in your network have exceeded important air quality thresholds. To see exceedance data, log into your Clarity Dashboard account and navigate to the Overview page.
From there, scroll down to the Last 7 Days Air Quality Trends section. There you can see the number of times in the previous week that Clarity devices in your network have exceeded AQI and World Health Organization (WHO) thresholds.
By hovering over the data, you can see the number of exceedances for each threshold,as well as the number of devices that exceeded the threshold. This information can help you understand how widespread the exceedances were - did they impact the whole network or just a handful of devices? You can check out the data in more depth on the Explore page.

About the Thresholds
PM2.5 Nowcast AQI > 150: An Air Quality Index (AQI) above 150 is “unhealthy” and indicates that members of the public may experience health impacts with sensitive populations potentially experiencing more severe health impacts. The PM2.5 Nowcast AQI includes time-weighted PM2.5 data. You can find more info on the NowCast AQI here.
PM2.5 Concentrations > 25 µg/m³: The WHO sets a series of health-based air quality standards for several pollutants. The 24-hour threshold for PM2.5 is 25 µg/m³, meaning that a 24 hour average concentration above that level poses a potential health risk to the community. More information about WHO standards here.
NO₂ AQI > 150: This AQI is calculated using NO₂ data only. An NO₂ AQI > 150 indicates that the NO₂ concentrations are potentially harmful to health, particularly for sensitive populations.
NO₂ Concentration >200 µg/m³: This is the WHO 1-hour standard for NO₂ values. Any hourly average concentration values above this threshold may cause negative health effects.
Currently, exceedance information is available for Clarity devices that you manage or that you have a data subscription for. Exceedances are calculated using calibrated PM2.5 and NO₂ data when available. If calibrated data is not available, raw values are used in the calculation. We hope to add exceedance information for government reference monitors in the future.
