Embed Clarity OpenMap in your website via iFrame
Clarity OpenMap is a ready-to-use solution for sharing air quality data with your community. Click here to learn more about OpenMap. Follow these simple steps to embed OpenMap or a live air quality widget in your website
1. Publish Your Data on OpenMap
Before embedding, ensure that Clarity has permission to publish your data on OpenMap. Follow this link to see how to make your data public.
2. Access the Widget Builder
- If using OpenMap, go to map.clarity.io/world.
- If using OpenMap Plus, navigate to your custom white-label map address.
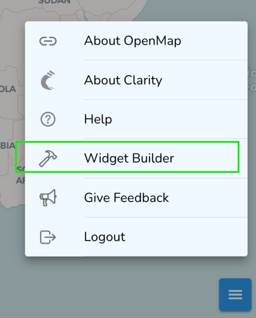
Click the hamburger menu in the bottom-right corner and select “Widget Builder”.
3. Choose Your Widget
In the Widget Builder, choose one of the following options:
- Map: Embed the entire interactive map.

- Current Air Quality: Embed a live air quality widget for a specific Datasource.

4. Customize Your Widget
- Adjust appearance: Use the form to customize the widget’s width, height, and border.
- For Map embeds: Use the preview to zoom, pan, select a Datasource, or search for a location. The embedded iFrame will preserve the exact state shown in the preview.
- For Current Air Quality embeds: Select the specific Datasource you want to display live air quality data for.
5. Copy the Embed Code
Once the widget looks right in the preview:
- Click the Copy button to copy the generated embed code.

6. Add the Code to Your Website
Paste the embed code into the appropriate location in your website’s HTML to add the iFrame.
Code a Custom data sharing portal
If you want more flexibility, you can develop your own interface using our API. This requires coding, but it allows you to develop something customized to your project. Several of our projects are using our API for a custom public portal, including UCLA and Breathe London.