Note: after you configure your first Node-S, it will take up to 1 hour to see data on Overview.
On the Overview page, you can view the most recent air quality data from your sensor network at a glance. This page provides a snapshot of current air quality conditions at your project site, allowing you to quickly monitor key metrics at a glance and identify any outlier Datasources for further investigation using the tools available in the Clarity Dashboard.
Here’s what you’ll find on the Overview page:
Current Air Quality Conditions

You can view air quality data in a sortable table and on an interactive map, both displaying the latest measurements from each Datasource. Additionally, a bar chart shows how many Datasources report their latest data in each AQI category or pollutant concentration range. Finally a time series plot compares the latest 48 hours of measurements from each Datasource.
If something catches your attention, you can drill Down: Click on a map marker, table row, or chart line to highlight a Datasource of interest. From there, you can interact with the map info box or the icon in the table to view detailed Datasource information.
Current Monitoring Network Conditions

This section provides an overview of how many devices and modules are deployed in your network and their current status (Healthy, Offline, etc.).
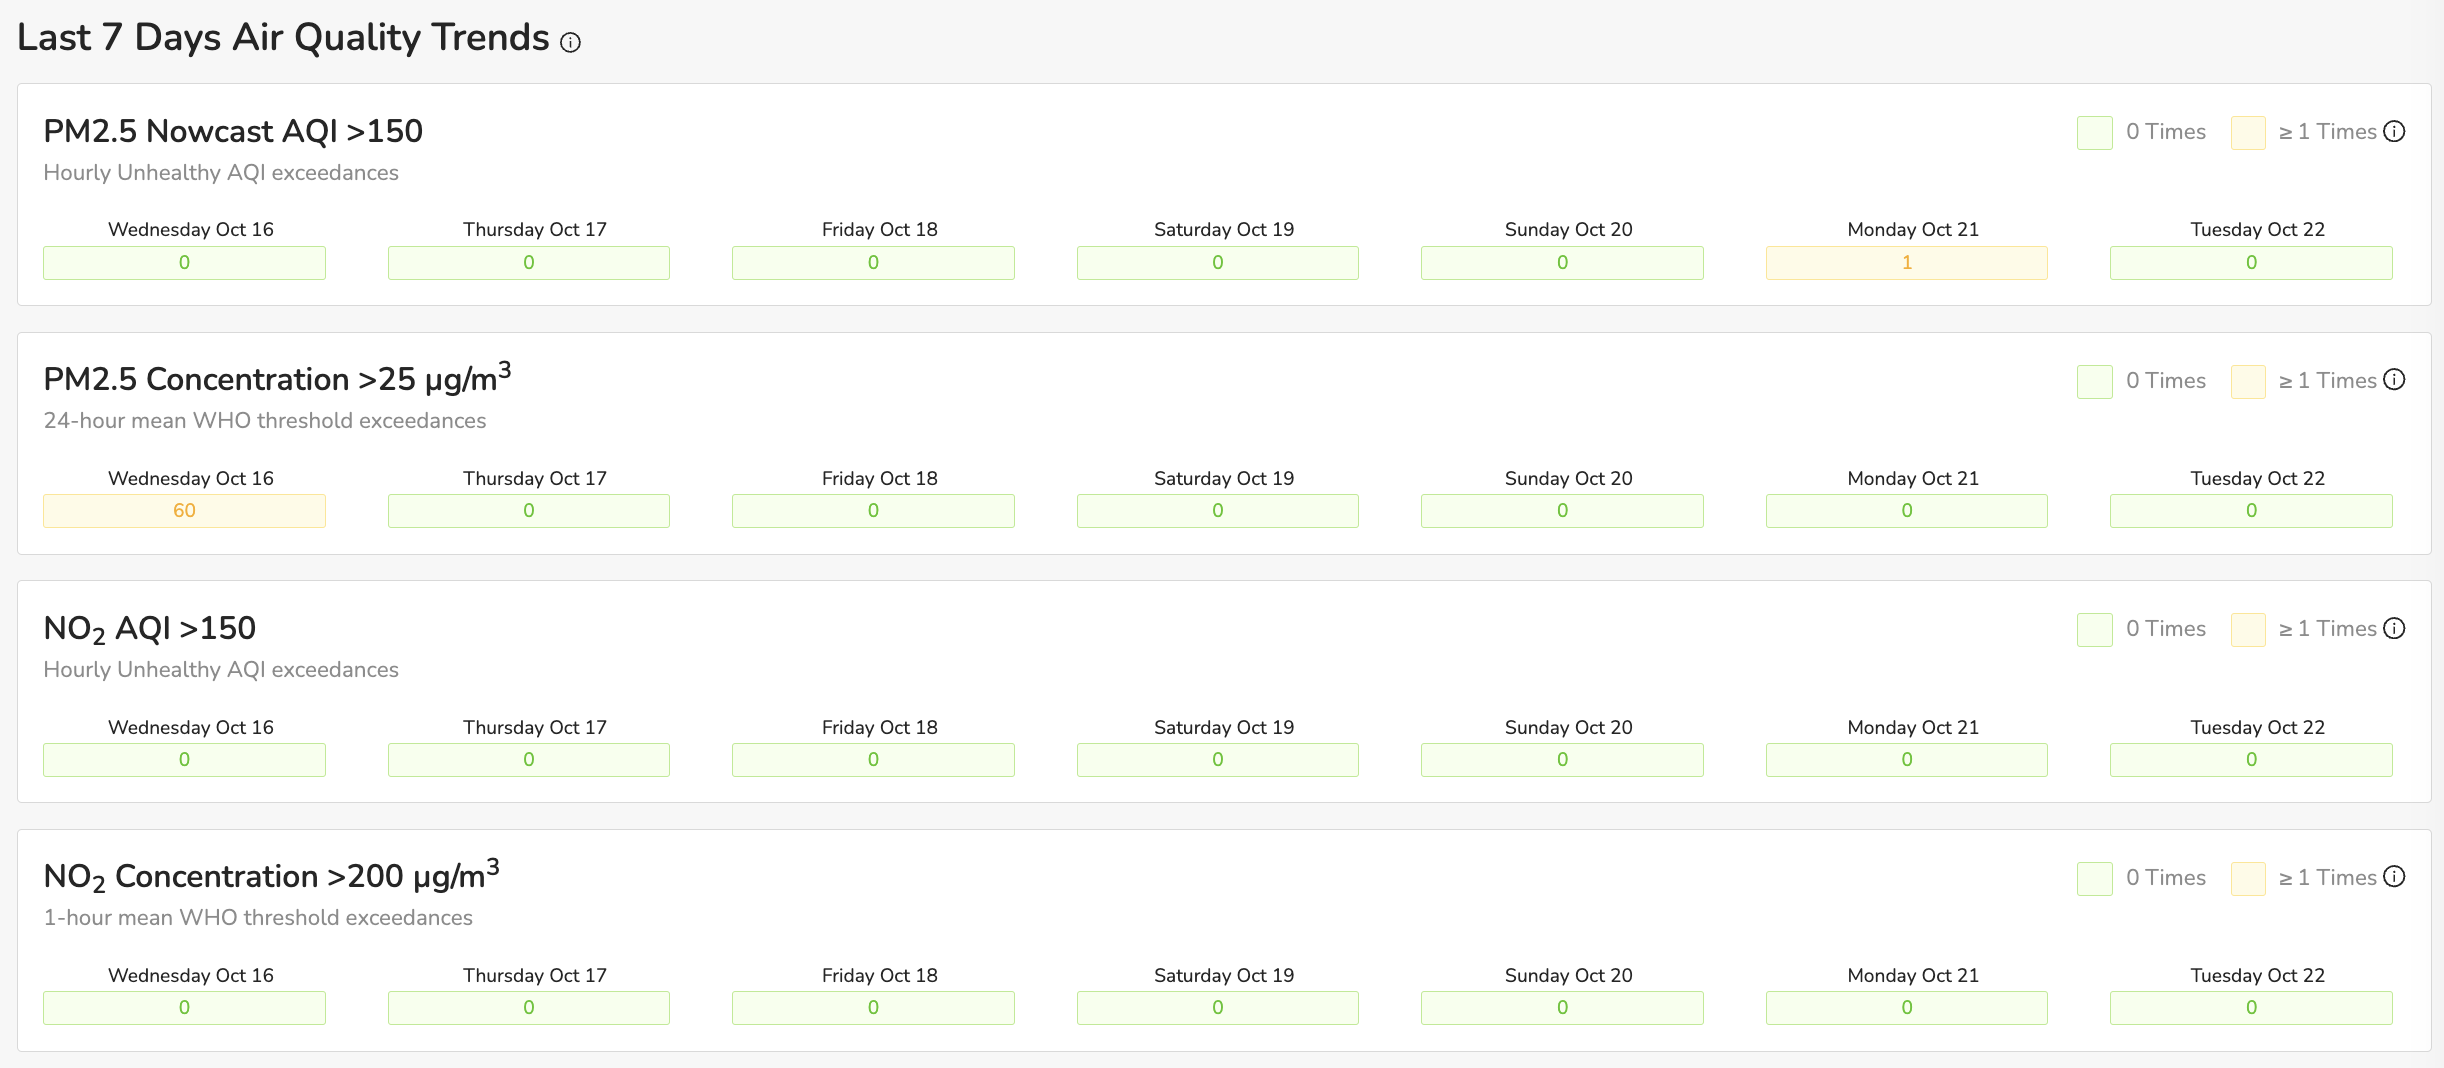
Air Quality Trends
A 7-day view of how many times different notable pollution thresholds were exceeded. More info here.
This high-level overview helps you assess current air quality conditions and manage your air quality monitoring network effectively, allowing you to make informed decisions based on the latest data.