This feature is only available if you have a Clarity Node-S + Wind Module.
- If you'd like to learn more about the wind module, please fill out this form here and we'll be in touch!
- If you'd like to deploy your wind module, please check out the Wind Deployment Guide. You will need to configure your Clarity Node-S device first.
The Clarity Node-S + Wind Module is designed to work seamlessly to provide you with air quality and wind measurements. One way to visualize the wind speed and direction data collected is using a wind rose.
Finding the Wind Rose feature
- Sign-in on Dashboard
- Navigate to Analytics > Explore map.
- In the Parameter Selector, select Wind

- Click on a Clarity device that has the wind module attached (pin is not gray).
- Click on "Advanced Charts".
- A pop-up window with plotting features will be available. Click on the "Wind Rose" tab.
Understanding the Wind Rose
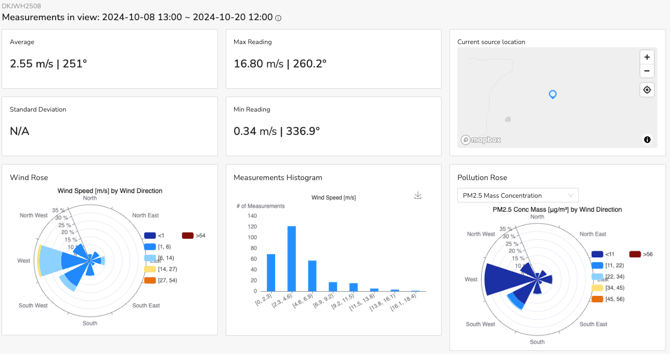
The wind rose shows a summary of wind direction and speed for the loaded data period.
- The eight sections of the circular wind rose show the direction the wind blew from.
- The length of each spoke in the eight sections shows how often (percentage of the sampling period) the wind blew from that direction.

- For example, in the Wind Rose above the wind blew from the West for about 35% of the time.
- The different color bands of each spoke provide information on the wind speed in meters/second (m/s). If you hover over a spoke, you can see more details

- For example, in the Wind Rose above the wind speed was between 6 and 14 m/s for about 18% of the time while it was blowing from the West
Pollution Roses
Instead of visualizing wind speed, you can visualize any pollutant concentration together with wind direction using Pollution Roses. To do that:
- While viewing the Wind Rose chart, use the parameter selector to change to a pollutant concentration or AQI

- You will see that the chart spokes change color

- If you now hover on a spoke, you can see information about the pollutant concentration or AQI measured while the wind was coming from that direction.

- For example, in the Pollution Rose above AQI was moderate for about 3% of the time while the wind was blowing from South West.
Pollution Roses can help you answer questions such as:
- Are higher concentrations or AQIs happening mostly when wind comes from a certain direction?
- Is a known pollution source located to the (e.g.) West of my device impacting air quality at the device deployment site?
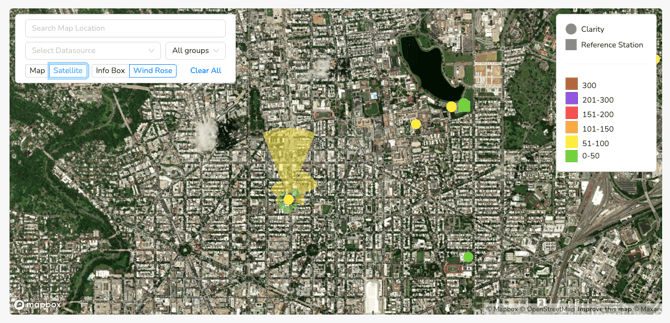
Other ways to view Wind and Pollution Roses
- In Analytics / Explore, directly on the map if you toggle the "Wind Roses" switch on. To show the Wind or Pollution Rose, click on a marker that has Wind data.
- In the Datasource Measurements page, if the selected Datasource has a Wind data and Wind is selected in the Parameter selector.